In the fast-paced world of architecture, engineering, and construction (AEC), efficiency and precision are paramount. Building Information Modeling (BIM) has revolutionized the industry by enabling detailed, accurate, and collaborative design processes. However, as projects become more complex, the need for automation within BIM workflows becomes increasingly critical. Automation not only enhances productivity but also minimizes human error, ensuring consistent and reliable outcomes.
Enter Dynamo, a visual programming tool that integrates seamlessly with Revit, offering a powerful means to automate repetitive and complex tasks. Dynamo empowers users to create custom scripts that can perform a myriad of functions, from geometry creation to data extraction and analysis.
One of the key areas where automation can significantly impact project efficiency is Lighting Power Density (LPD) analysis. LPD is a crucial factor in building design, influencing both energy efficiency and compliance with regulatory standards. Traditionally, LPD analysis has been a time-consuming process, requiring meticulous data collection and calculation. However, with the advent of a new Dynamo script, this task has been transformed into a single-click operation.
In this blog post, we delve into the capabilities of this innovative Dynamo script that streamlines LPD analysis within Revit. We’ll explore how this tool can save time, reduce errors, and enhance the overall design process, making it an indispensable asset for BIM professionals.
Procedure
The primary objective of the Dynamo script is to automate the placement of supports for all pipes in the Revit project while adhering to the following criteria:
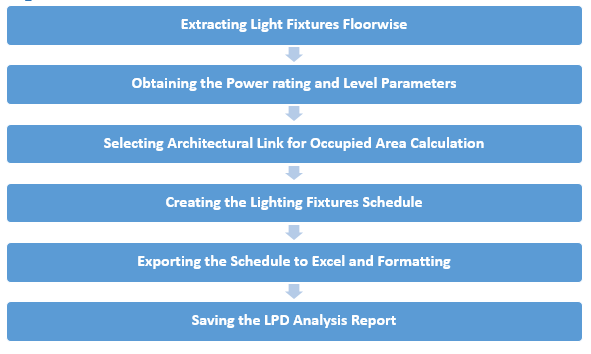
Extracting Light Fixtures Floor wise
:Retrieve all light fixtures from the Revit model, organized by floor. This ensures that the LPD analysis accounts for the specific distribution of lighting fixtures throughout the building.
Obtaining the Power Rating and Level Parameters:Input the parameter name that contains the power rating (in Watts) for each light fixture. This parameter will be used to calculate the total lighting power density.
Selecting Architectural Link for Occupied Area Calculation:Choose the appropriate architectural link to calculate the occupied area from rooms. Accurate area calculations are essential for determining LPD.
Creating the Lighting Fixtures Schedule:
Generate a schedule in Revit that includes fixture names, floor levels, quantities, and power ratings (in Watts). This schedule consolidates all necessary data for the LPD analysis.
Exporting and Formatting the Schedule to Excel:
Export the lighting fixtures schedule to an Excel file. Use Python to format the Excel sheet according to the required specifications, ensuring clarity and ease of use.
Saving the LPD Analysis Report:
Save the complete LPD analysis report as an Excel file in the specified output directory. This final report provides a comprehensive overview of the lighting power densities, facilitating further design decisions and compliance checks.
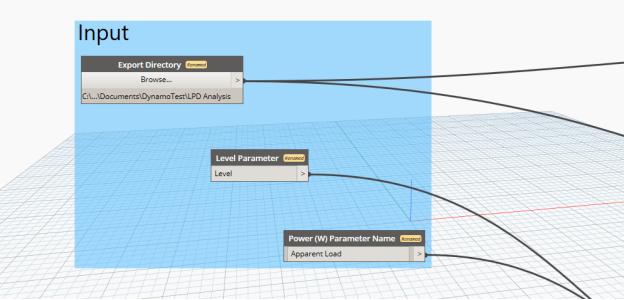
Image.1 Dynamo Input Provided
Image.2 Diagram of Workflow Steps
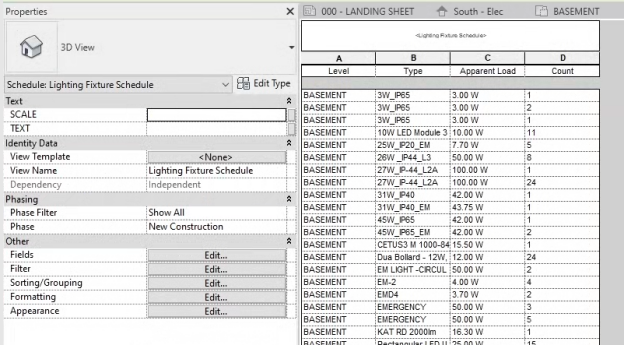
Image.3 Sample Lighting Fixture Schedule
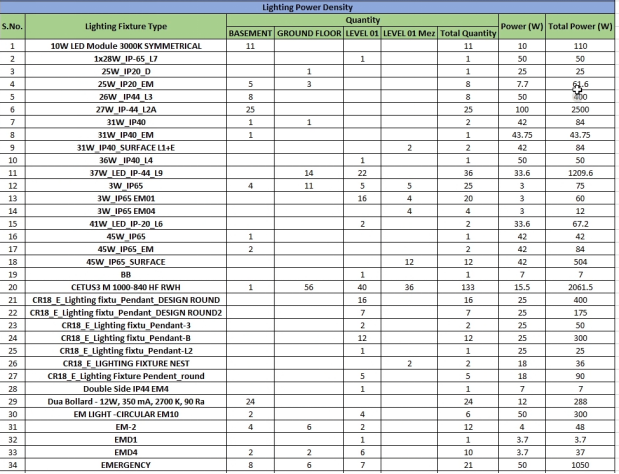
Image.4 Final LPD Analysis Report
Conclusion:
Automation in BIM is transforming the AEC industry by enhancing efficiency and accuracy. The Dynamo script for one-click LPD analysis exemplifies this transformation, simplifying a traditionally complex process into an effortless task. By integrating this script into your Revit workflows, you can save time, reduce errors, and ensure compliance with energy standards.
A competent BIM professional with a passion for leveraging automation to streamline workflows. With 2+ years of experience in the AEC industry, he has successfully implemented automation solutions utilizing tools like Dynamo, Plugins, and VBA to enhance project efficiency and accuracy. His expertise lies in HVAC Designing, Thermal Engineering, and BIM Methodologies.